fiscal/cofog_from_oecd.csv | National Accounts at a Glance, chapter 6A, OECD.SDD.NAD,DSD_NAAG_VI@DF_NAAG_OTEF, measure OTES13F | OECD | 2005-2023 | Other |
|---|
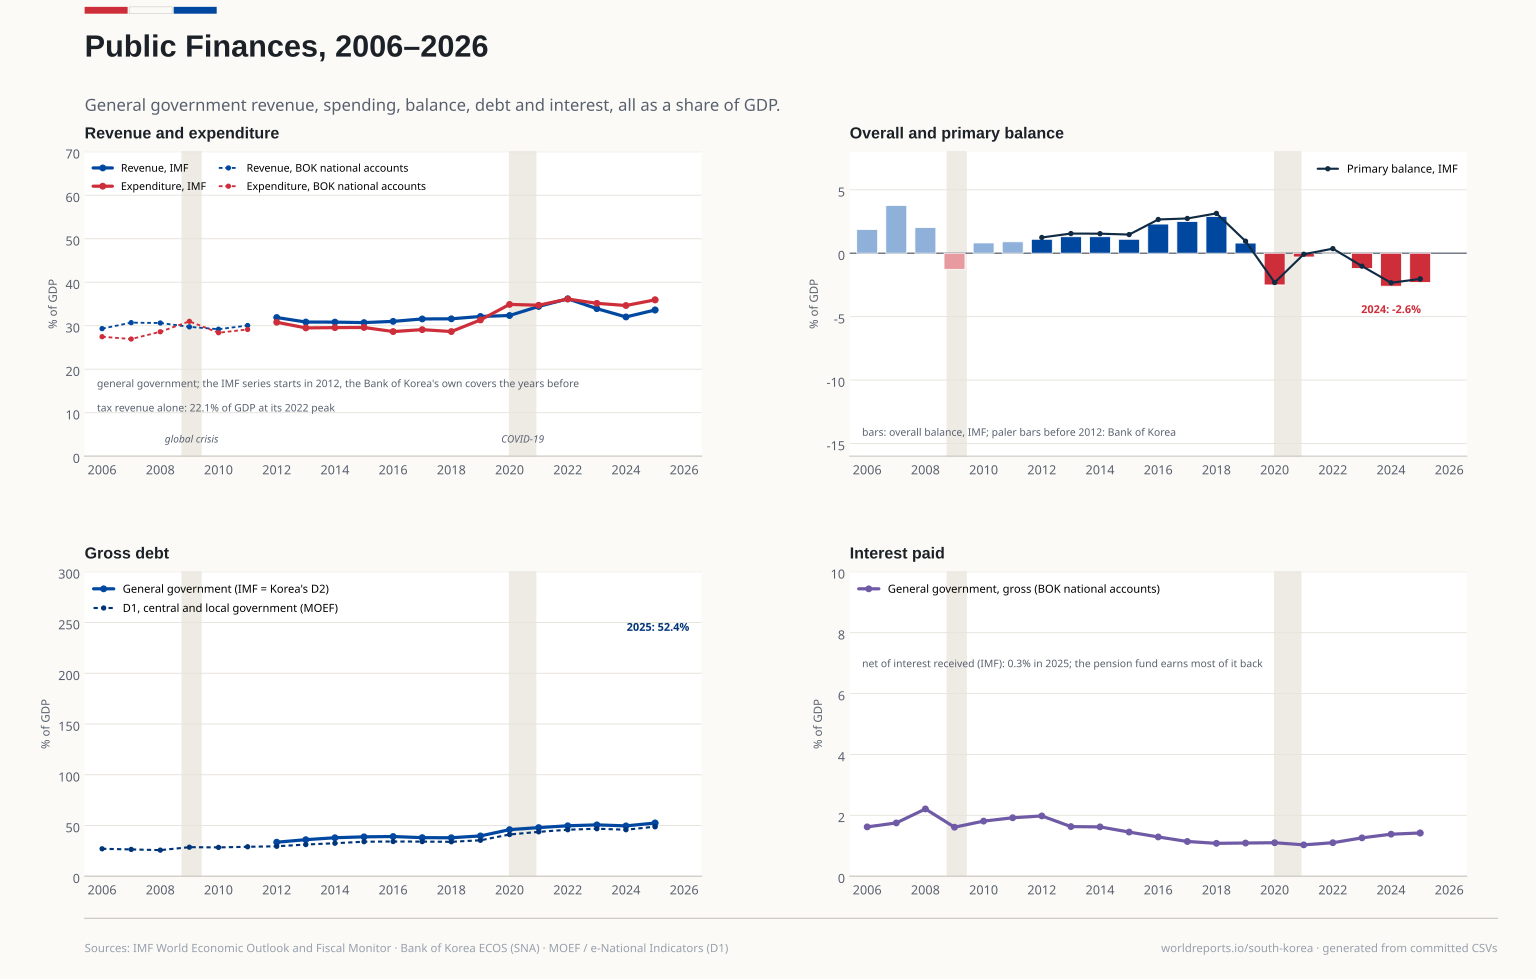
fiscal/debt.csv | Public debt on the two official definitions, D1 and D2 | Ministry of Economy and Finance, via e-National Indicators | 2006-2026 | Official |
|---|
fiscal/general_government_from_imf.csv | World Economic Outlook and Fiscal Monitor, via DataMapper (GGR_G01_GDP_PT (Fiscal Monitor), G_X_G01_GDP_PT (Fiscal Monitor), GGXCNL_NGDP (WEO)… | IMF | 2012-2025 | Other |
|---|
fiscal/general_government_imf.csv | General government revenue, expenditure, balances and gross debt | IMF (World Economic Outlook and Fiscal Monitor) | 2012-2025 | Other |
|---|
fiscal/government.csv | General government revenue, expenditure and net lending | Bank of Korea (SNA general government account) | 2006-2026 | Official |
|---|
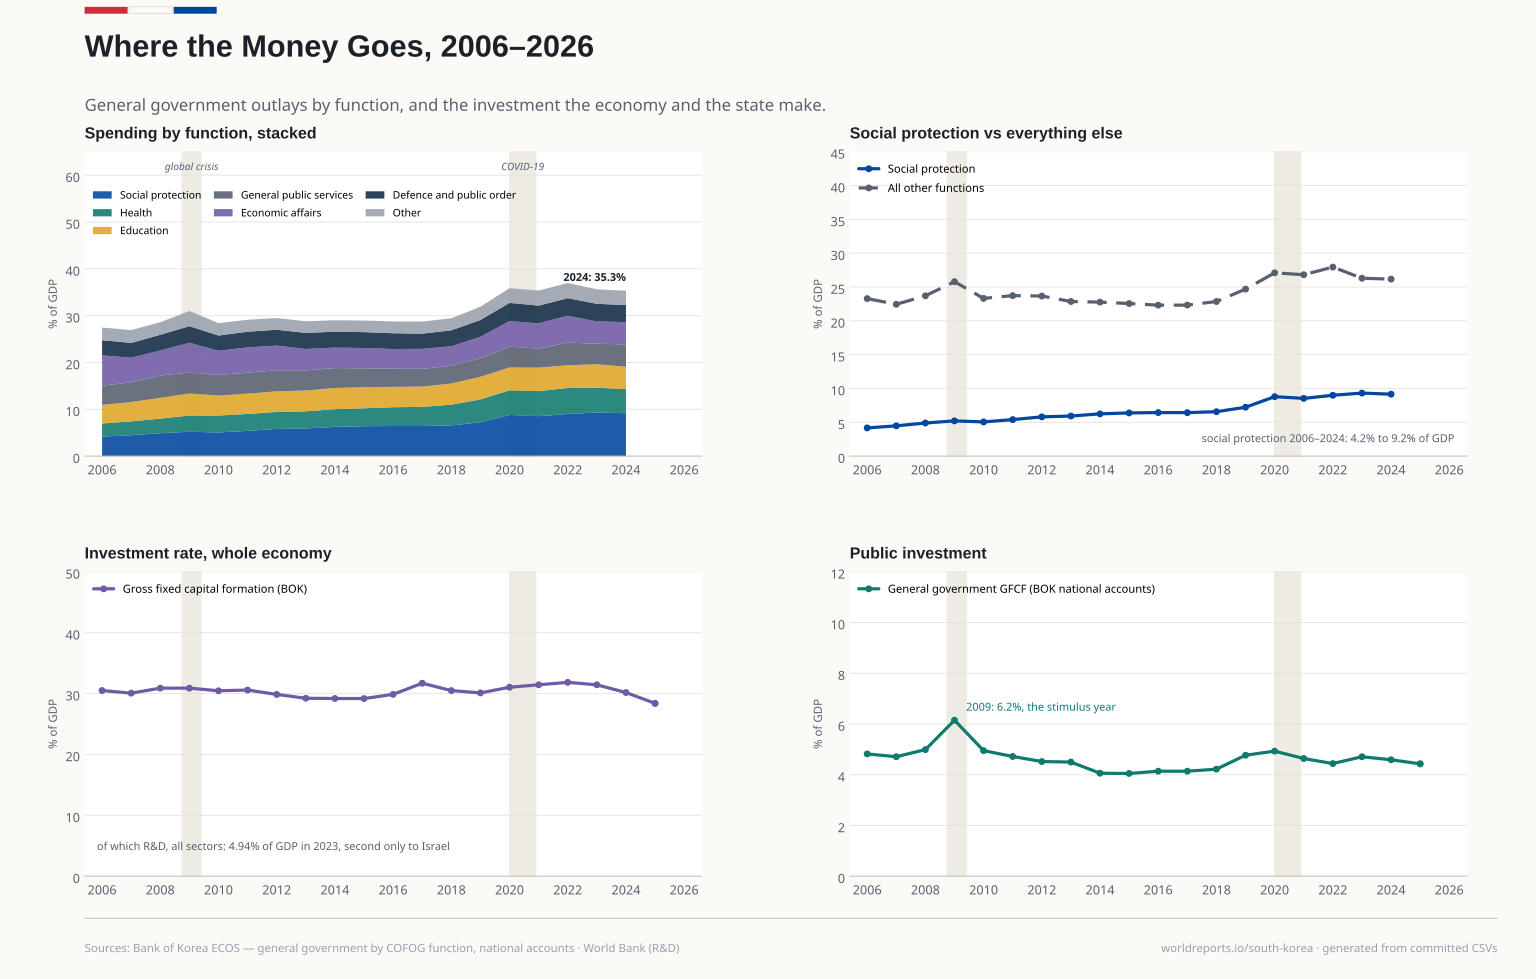
fiscal/investment.csv | Gross fixed capital formation | Bank of Korea (national accounts) | 2006-2026 | Official |
|---|
fiscal/public_investment_from_oecd.csv | National Accounts at a Glance, chapter 6, OECD.SDD.NAD,DSD_NAAG_VI@DF_NAAG_VI, measure P51GS13 | OECD | 2005-2025 | Other |
|---|
fiscal/rnd.csv | Research and development expenditure | World Bank (from OECD/UNESCO) | 2006-2023 | Official |
|---|
fiscal/spending_by_function.csv | General government expenditure by COFOG function | Bank of Korea | 2006-2026 | Official |
|---|
fiscal/spending_by_function_krw.csv | General government expenditure by COFOG function, in won | Bank of Korea | 2006-2026 | Official |
|---|
fiscal/tax_burden.csv | Tax burden — total tax revenue as a share of GDP | Statistics Korea / Ministry of Economy and Finance, via ECOS | 2006-2026 | Official |
|---|
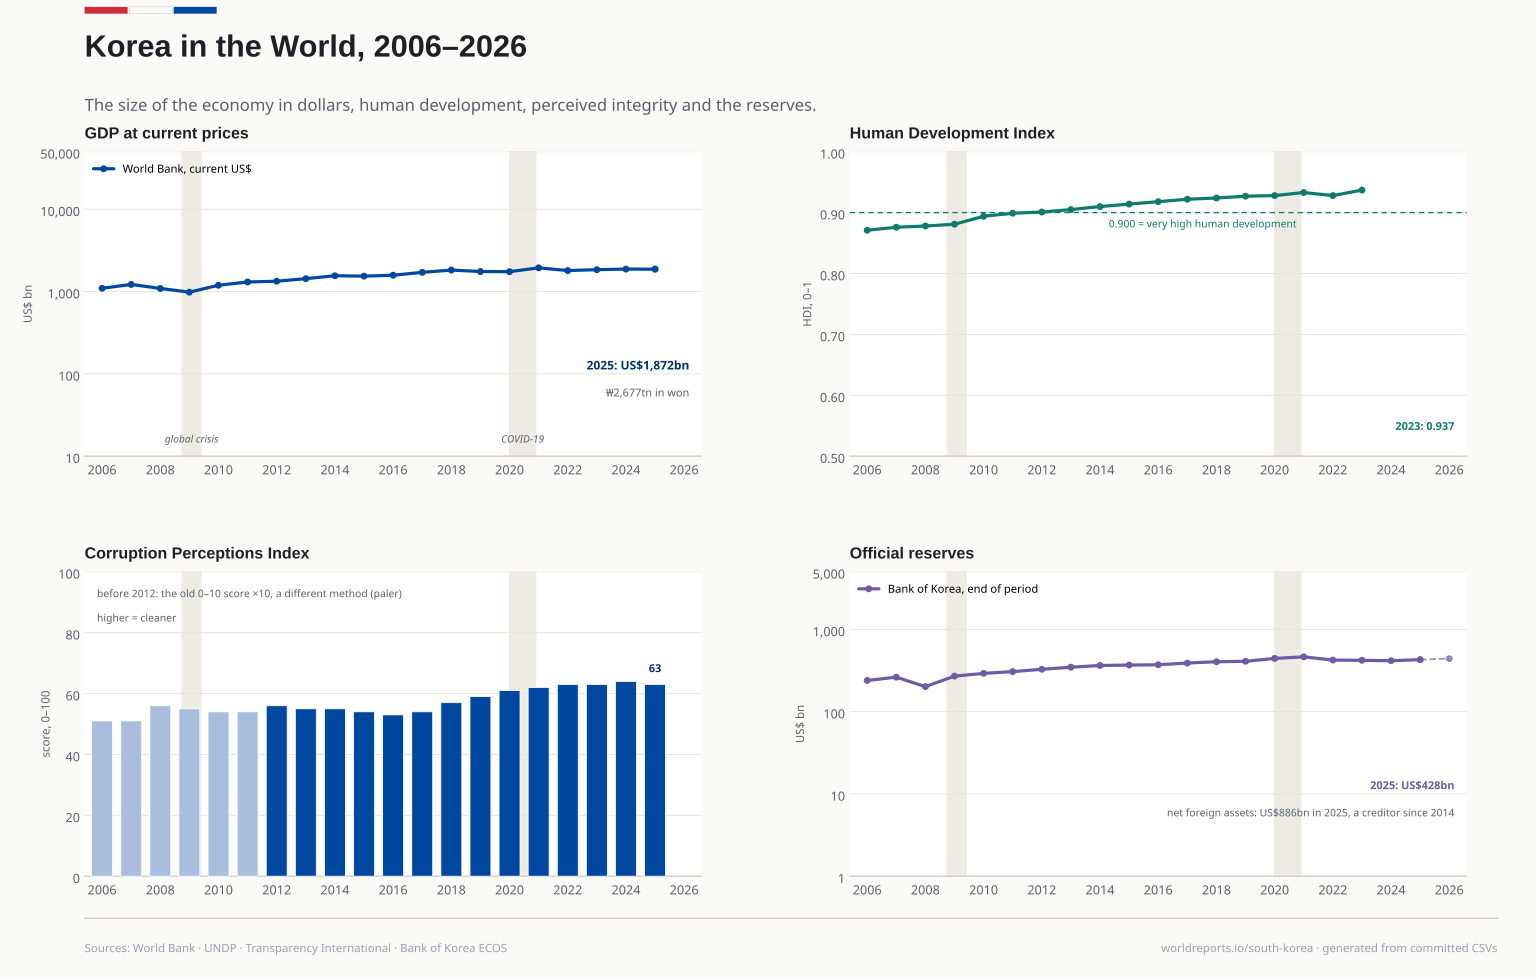
intl/cpi.csv | Corruption Perceptions Index — Korea's score and rank | Transparency International | 2006-2025 | Official |
|---|
intl/cpi_from_ti.csv | Corruption Perceptions Index time series, as published | Transparency International | 2012-2024 | Official |
|---|
intl/openness.csv | Trade openness — exports plus imports as a share of GDP | World Bank (national accounts) | 2006-2025 | Official |
|---|
intl/world.csv | GDP and GDP per person in current US dollars | World Bank (World Development Indicators) | 2006-2025 | Other |
|---|
intl/world_from_wb.csv | World Development Indicators (NY.GDP.MKTP.CD, NY.GDP.PCAP.CD, FI.RES.TOTL.CD) | World Bank | 2005-2025 | Other |
|---|
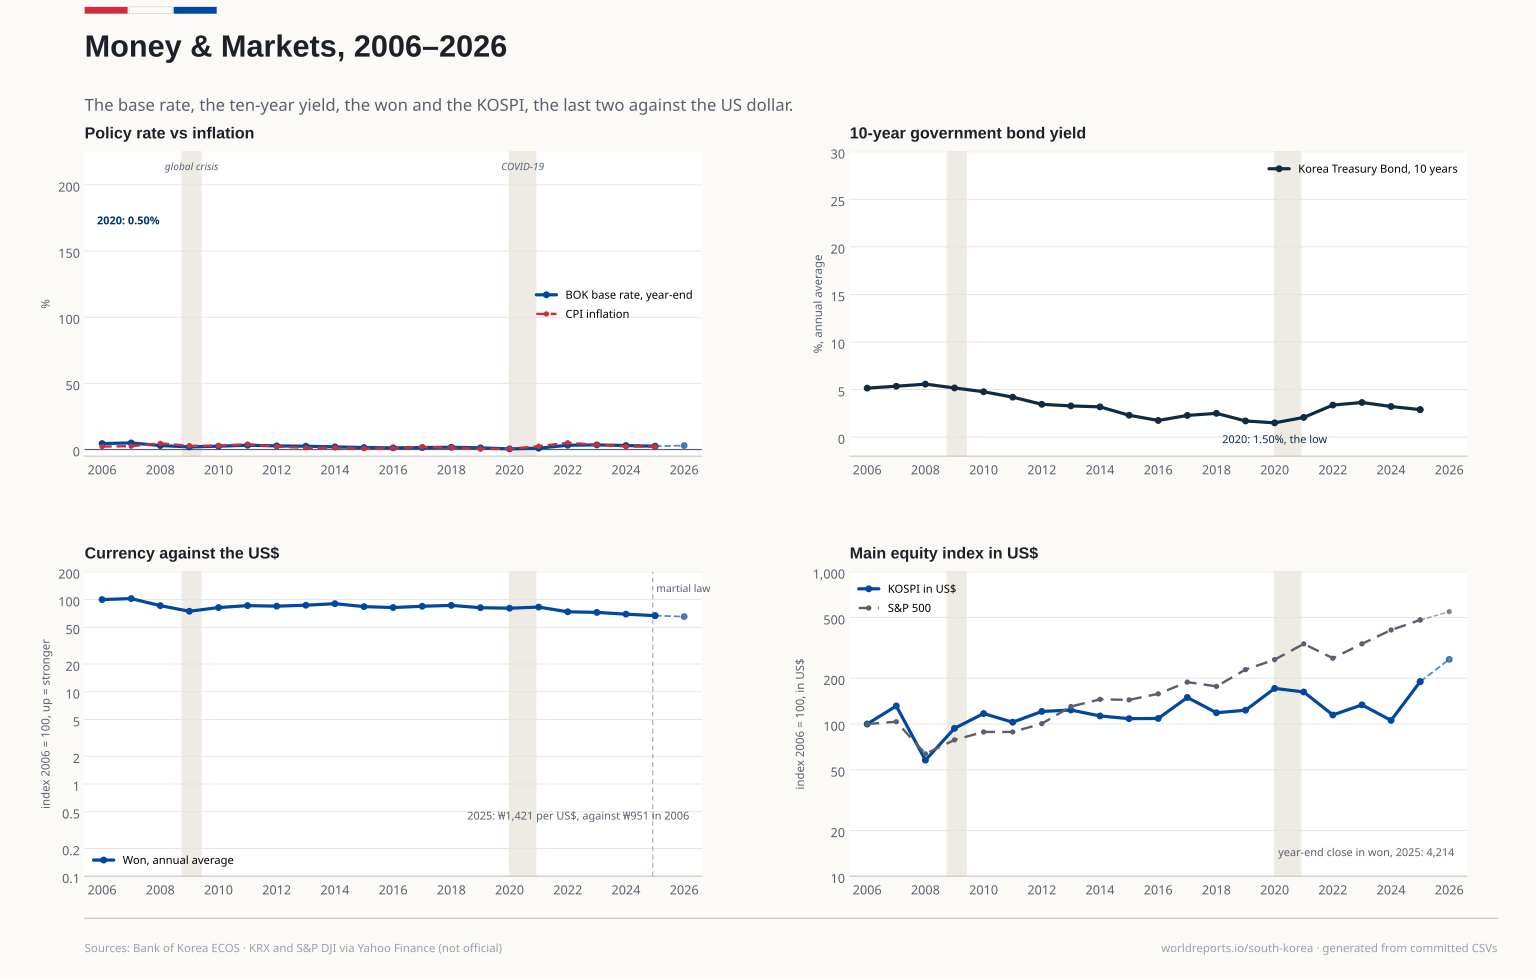
macro/base_rate.csv | Bank of Korea base rate | Bank of Korea | 2006-2026 | Official |
|---|
macro/cpi.csv | Consumer price index, all items — annual inflation | Statistics Korea, via Bank of Korea ECOS | 2006-2026 | Official |
|---|
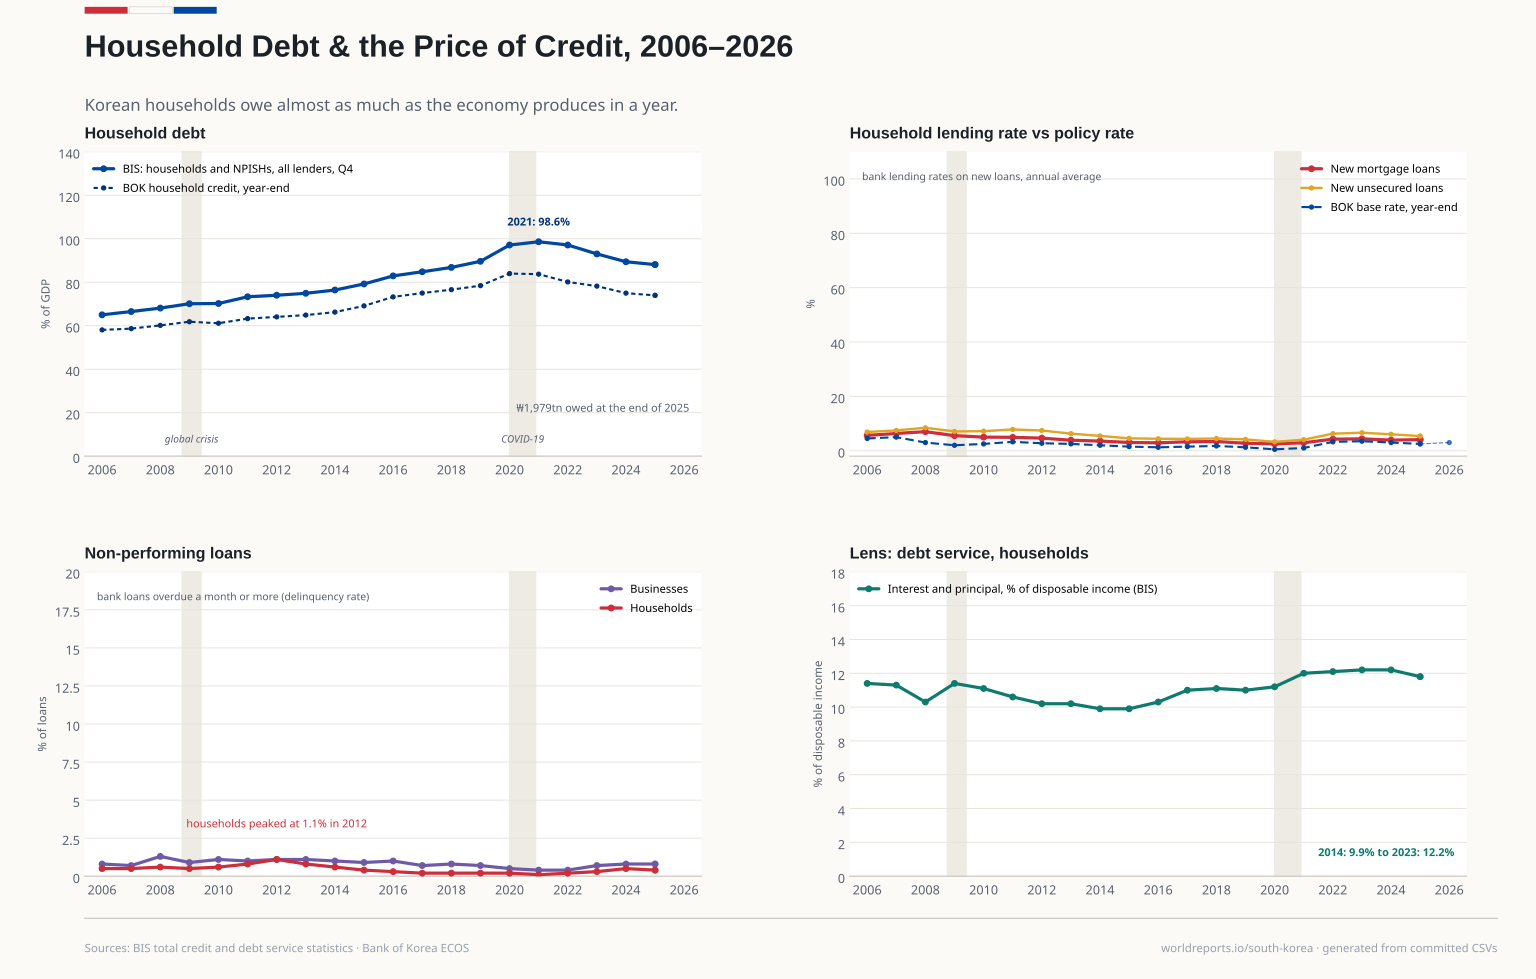
macro/credit_terms.csv | What credit costs and how much of it goes unpaid | Bank of Korea | 2006-2026 | Official |
|---|
macro/debt_service_from_bis.csv | debt service ratios, WS_DSR Q.KR.H | BIS | 2005-2026 | Other |
|---|
macro/economy_from_wb.csv | World Development Indicators (NE.GDI.FTOT.ZS, SL.UEM.TOTL.ZS) | World Bank | 2005-2025 | Other |
|---|
macro/external.csv | International investment position — external assets, liabilities and the net | Bank of Korea | 2006-2026 | Official |
|---|
macro/gdp.csv | Gross domestic product — nominal level, real growth, per capita, population | Bank of Korea (national accounts) | 2006-2026 | Official |
|---|
macro/household_bis.csv | Household debt and debt service ratio, BIS | BIS (total credit statistics, debt service ratios) | 2006-2025 | Other |
|---|
macro/household_credit.csv | Household credit — loans and card/instalment credit | Bank of Korea (flow of funds) | 2006-2026 | Official |
|---|
macro/household_credit_from_bis.csv | total credit statistics, WS_TC Q.KR.H.A.M.770.A | BIS | 2005-2026 | Other |
|---|
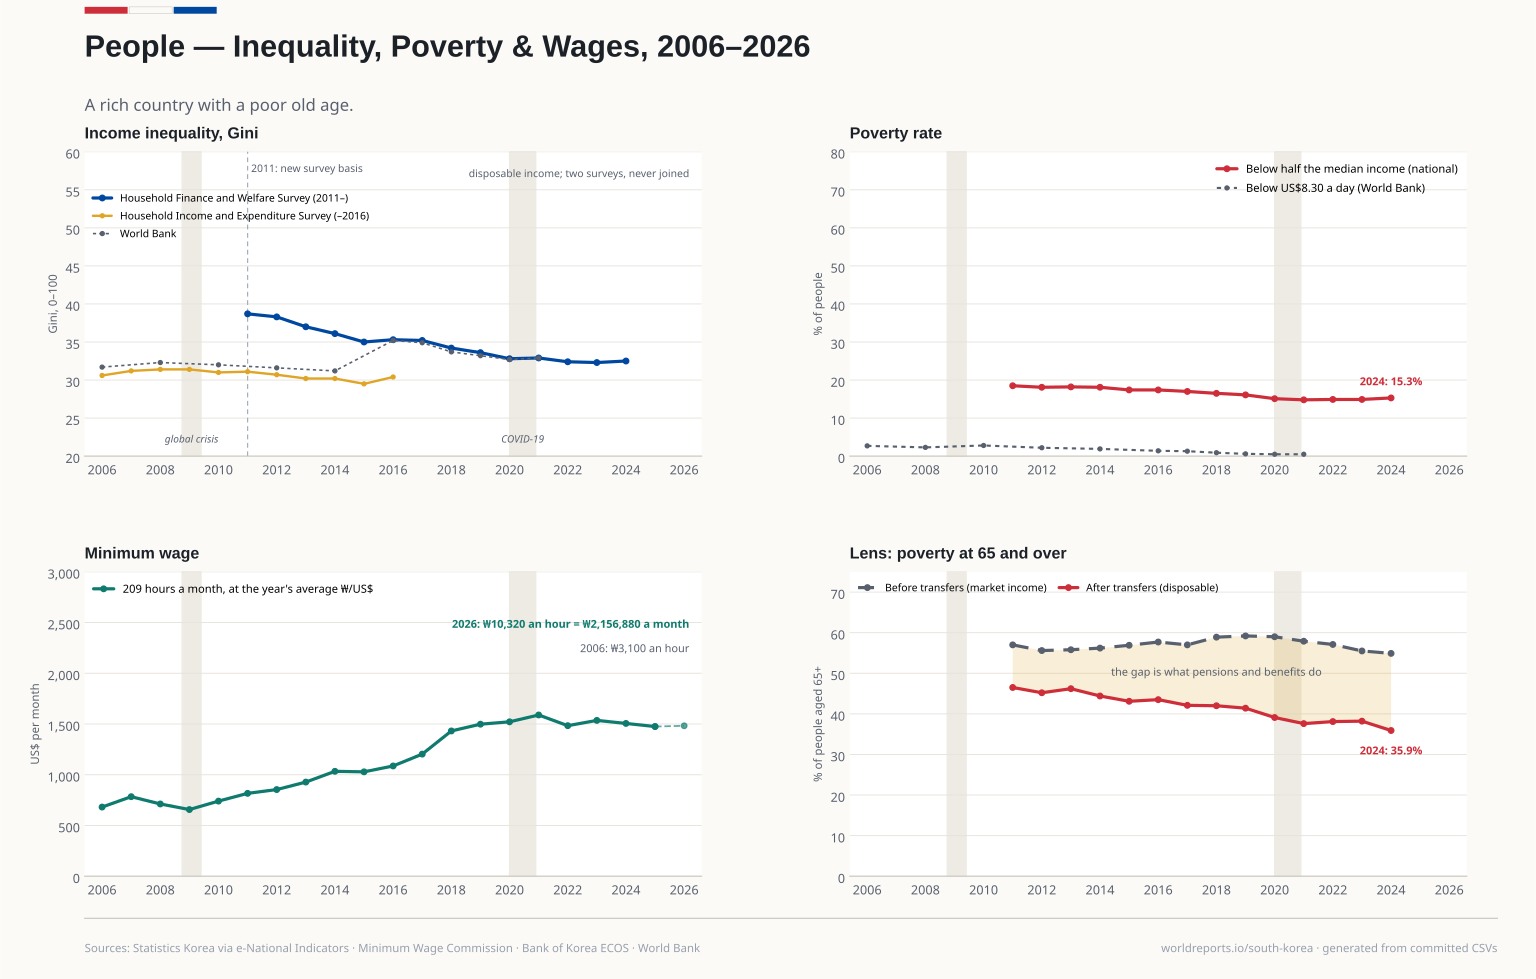
macro/minimum_wage.csv | Statutory minimum wage | Minimum Wage Commission / Ministry of Employment and Labour | 2006-2026 | Official |
|---|
macro/reserves.csv | Official foreign exchange reserves | Bank of Korea | 2006-2026 | Official |
|---|
macro/unemployment.csv | Unemployment rate | Statistics Korea (Economically Active Population Survey), via ECOS | 2006-2026 | Official |
|---|
macro/won.csv | Won per US dollar — annual average and year-end close | Bank of Korea | 2006-2026 | Official |
|---|
markets/bond_10y.csv | 10-year Korea Treasury Bond yield, annual average | Bank of Korea | 2006-2025 | Official |
|---|
markets/kospi.csv | KOSPI composite index, year-end close | Korea Exchange (index), retrieved via Yahoo Finance | 2005-2026 | Official |
|---|
markets/sp500.csv | S&P 500 index, year-end close | S&P Dow Jones Indices, retrieved via Yahoo Finance | 2005-2026 | Official |
|---|
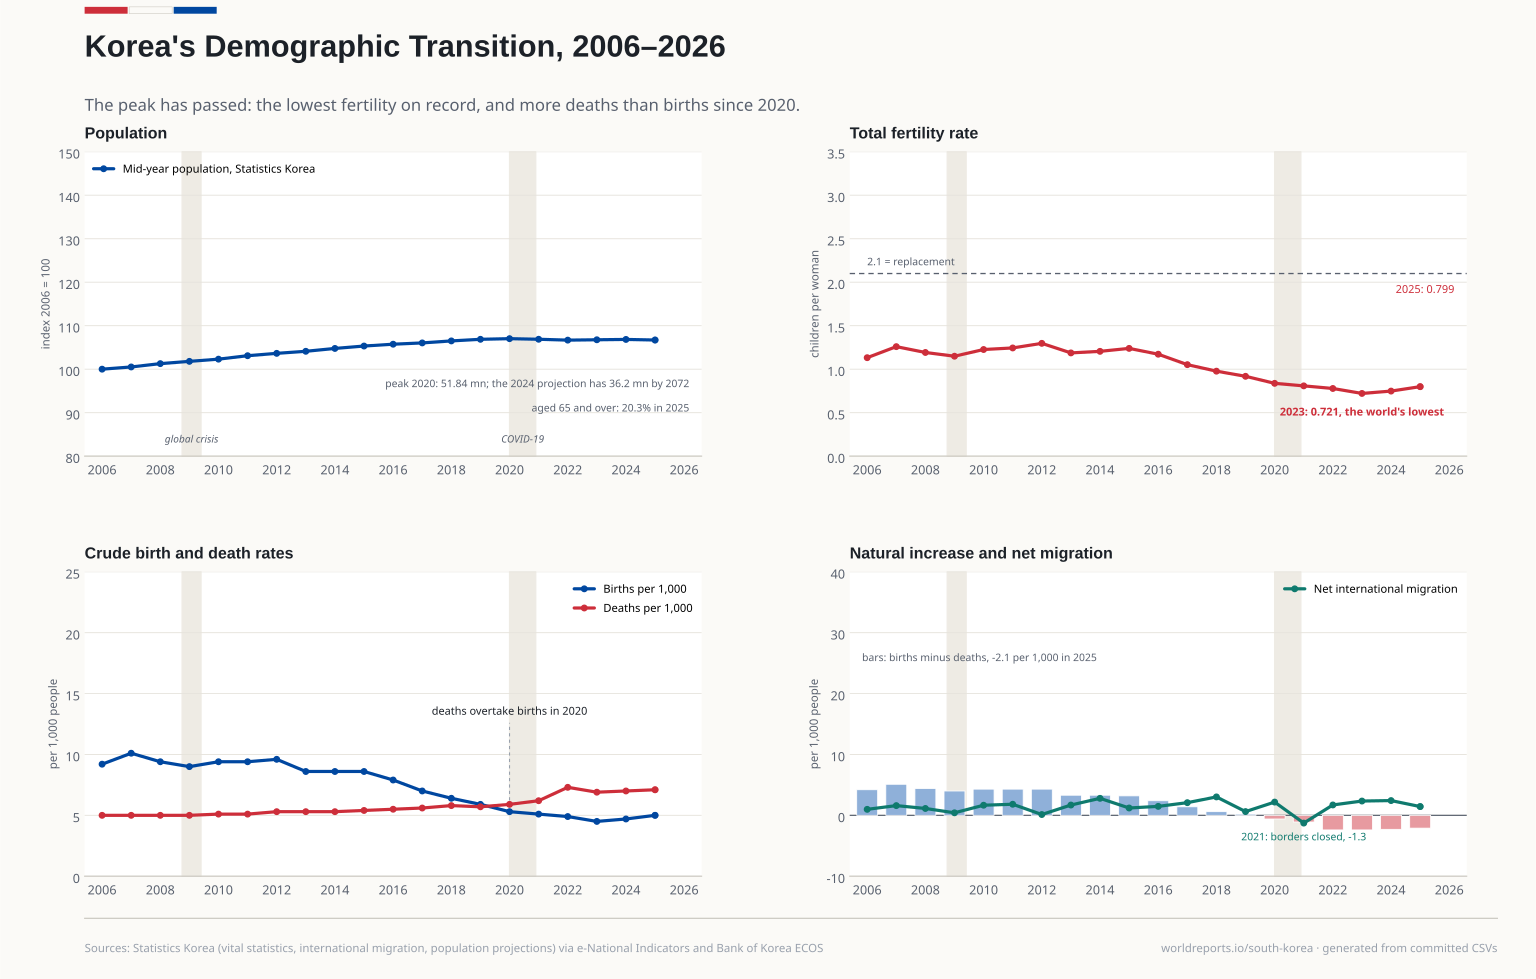
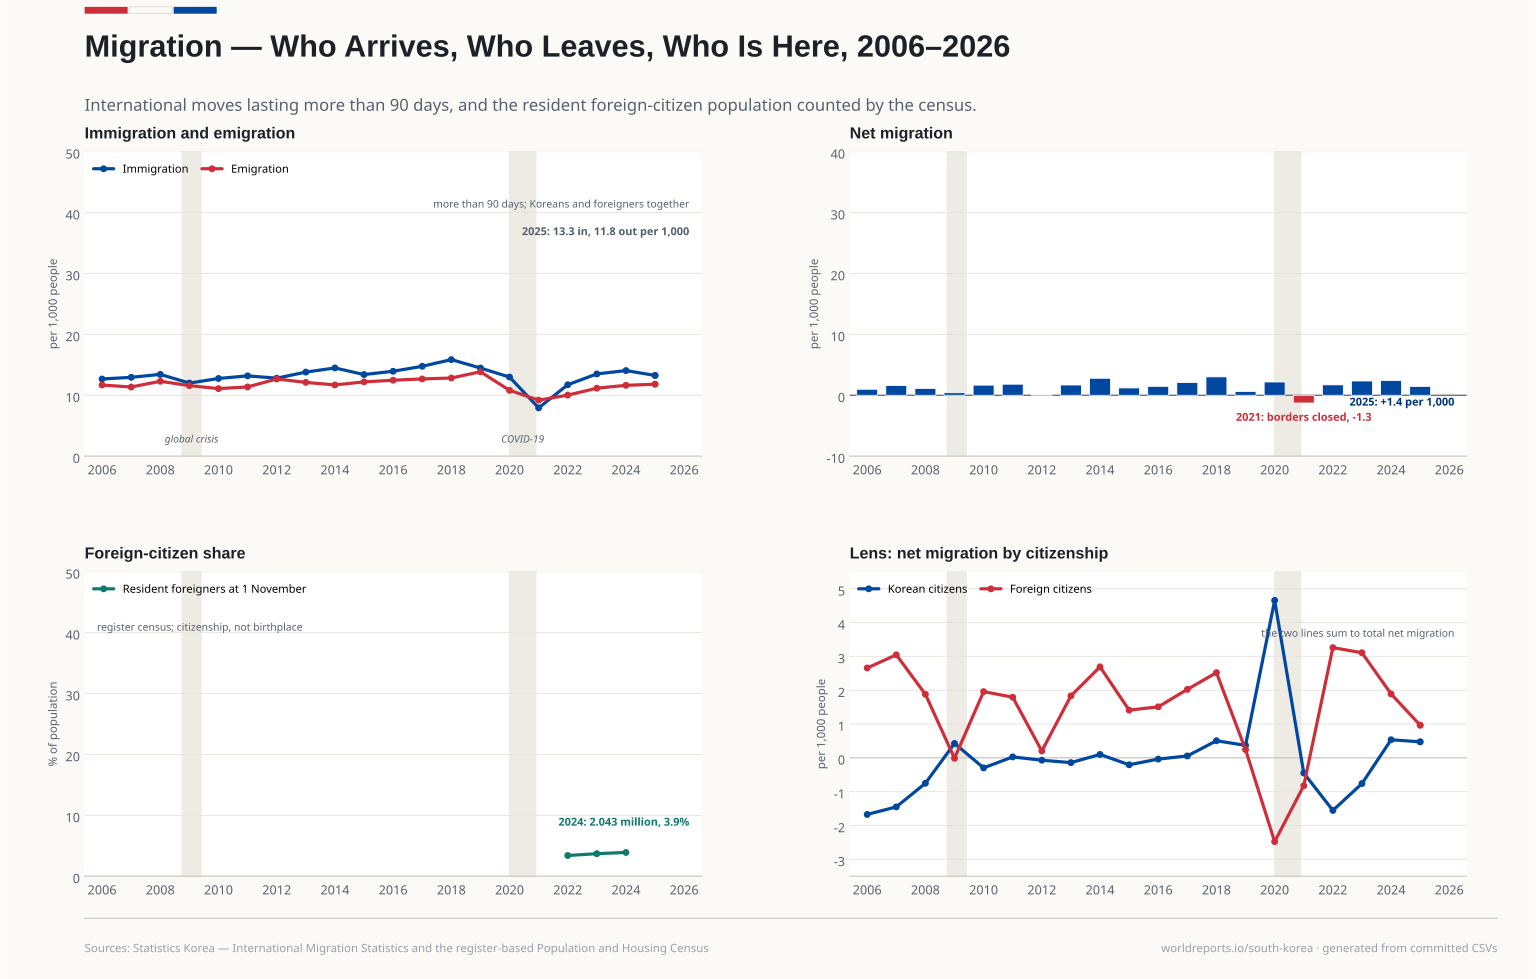
migration/flows_by_citizenship.csv | International migration by Korean and foreign citizenship | Statistics Korea — International Migration Statistics, via e-National Indicators | 2006-2025 | Official |
|---|
migration/foreign_residents_census.csv | Resident population by Korean and foreign citizenship | Statistics Korea — Population and Housing Census (register-based census) | 2022-2024 | Official |
|---|
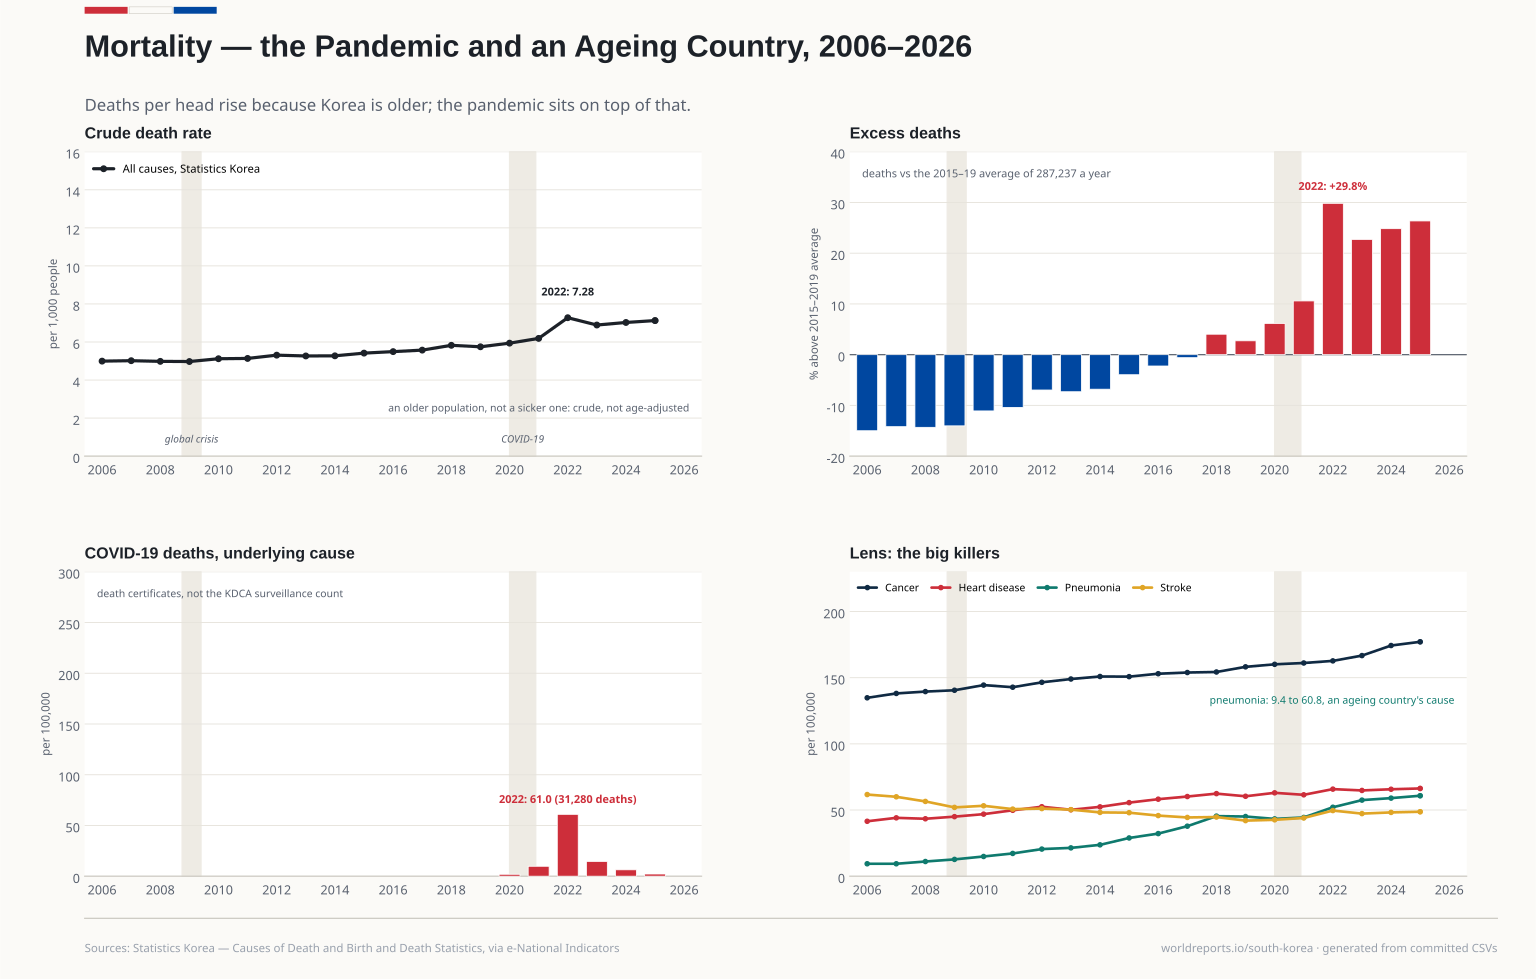
social/covid.csv | COVID-19 deaths | Statistics Korea / Ministry of Data and Statistics — Causes of Death Statistics | 2020-2026 | Official |
|---|
social/demography_from_wb.csv | World Development Indicators (SP.POP.TOTL, SP.POP.TOTL.FE.IN, SP.DYN.TFRT.IN, SP.DYN.CBRT.IN, SP.DYN.CDRT.IN, SM.POP.NETM), from the UN World… | World Bank | 2005-2025 | Other |
|---|
social/gini.csv | Gini coefficient of disposable income, by survey | Statistics Korea, via e-National Indicators | 2006-2026 | Official |
|---|
social/gini_from_wb.csv | Gini index, World Bank harmonised | World Bank | 2006-2021 | Official |
|---|
social/gini_wb.csv | Gini index, World Bank | World Bank (Poverty and Inequality Platform) | 2006-2021 | Other |
|---|
social/hdi.csv | Human Development Index | UNDP, Human Development Report Office | 2006-2023 | Official |
|---|
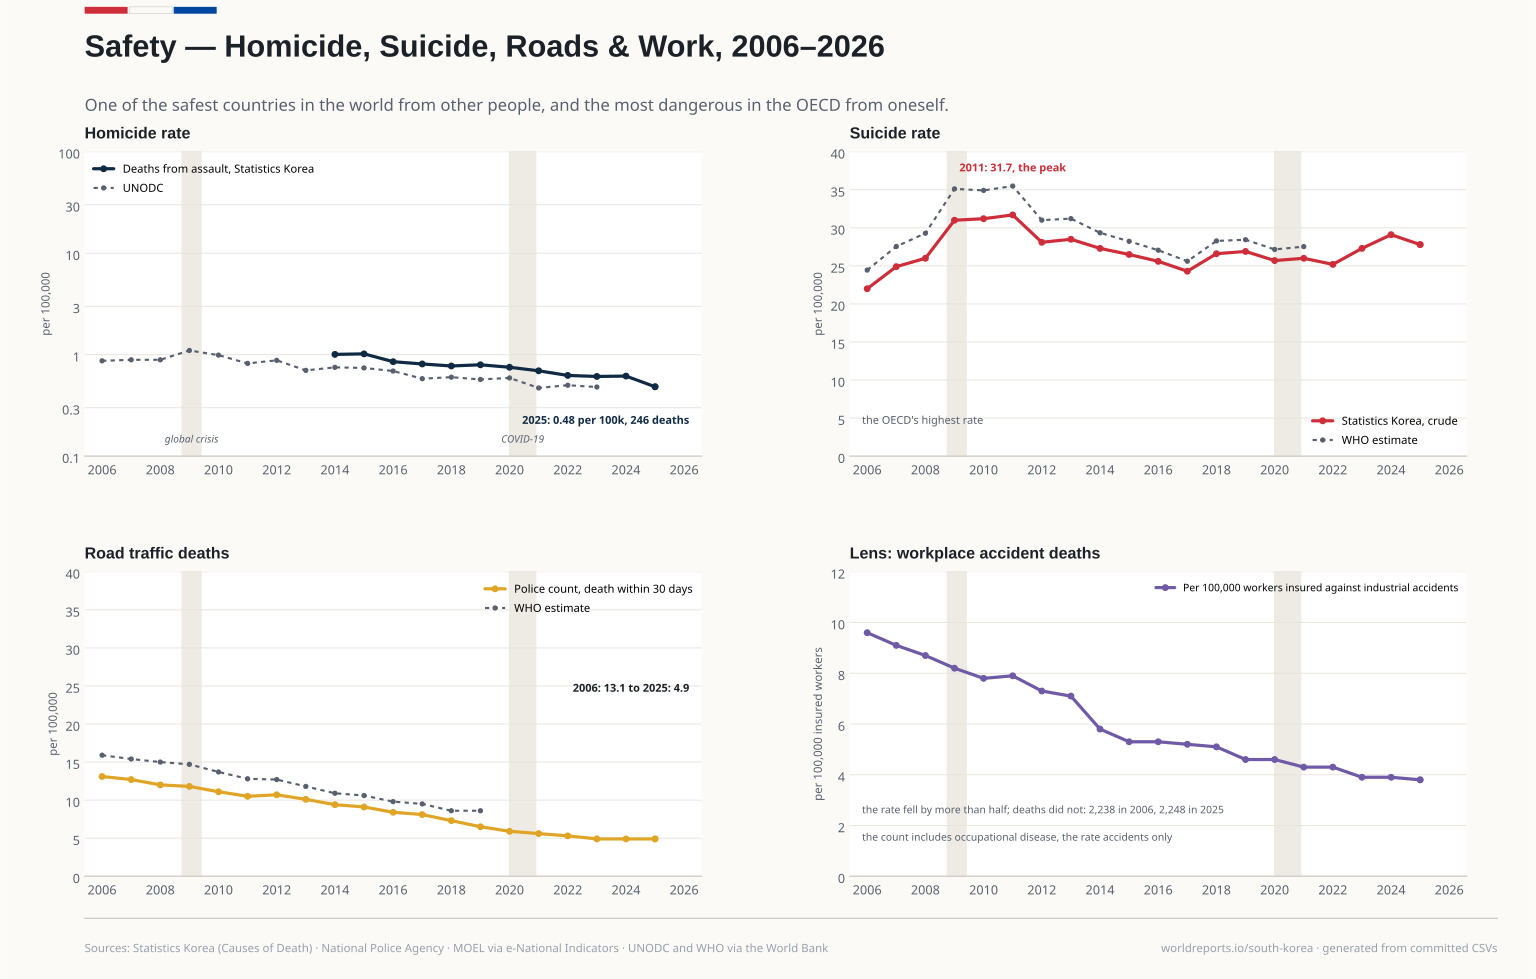
social/homicide.csv | Deaths from assault (가해/타살) | Statistics Korea / Ministry of Data and Statistics — Causes of Death Statistics | 2014-2025 | Official |
|---|
social/migration.csv | International migration — arrivals, departures and net migration | Statistics Korea — International Migration Statistics, via e-National Indicators | 2006-2026 | Official |
|---|
social/mortality.csv | Death rates by cause | Statistics Korea / Ministry of Data and Statistics — Causes of Death Statistics | 2006-2026 | Official |
|---|
social/population.csv | Population, share aged 65 and over, and total fertility rate | Statistics Korea — Population Projections (2024 revision) | 2000-2072 | Official |
|---|
social/poverty.csv | Relative poverty, whole population and at 65 and over | Statistics Korea, via e-National Indicators | 2006-2026 | Official |
|---|
social/poverty_from_wb.csv | Poverty headcount at the international lines | World Bank | 2006-2021 | Official |
|---|
social/poverty_wb.csv | Poverty headcount at US$8.30 a day (2021 PPP) | World Bank (Poverty and Inequality Platform) | 2006-2021 | Other |
|---|
social/road.csv | Road traffic deaths | National Police Agency, via e-National Indicators | 2006-2026 | Official |
|---|
social/security_from_wb.csv | World Development Indicators: VC.IHR.PSRC.P5 (UNODC), SH.STA.SUIC.P5 and SH.STA.TRAF.P5 (WHO Global Health Estimates) | World Bank | 2005-2023 | Other |
|---|
social/security_intl.csv | Homicide, suicide and road-death rates, international estimates | UNODC (homicide) and WHO (suicide, road deaths), via the World Bank | 2006-2023 | Other |
|---|
social/vital.csv | Births, deaths, natural change, fertility and life expectancy | Statistics Korea / Ministry of Data and Statistics — Vital Statistics | 2006-2026 | Official |
|---|
social/workplace.csv | Industrial accidents — injury rate, fatal accident rate, deaths, disease cases | Ministry of Employment and Labour, via e-National Indicators | 2006-2026 | Official |
|---|
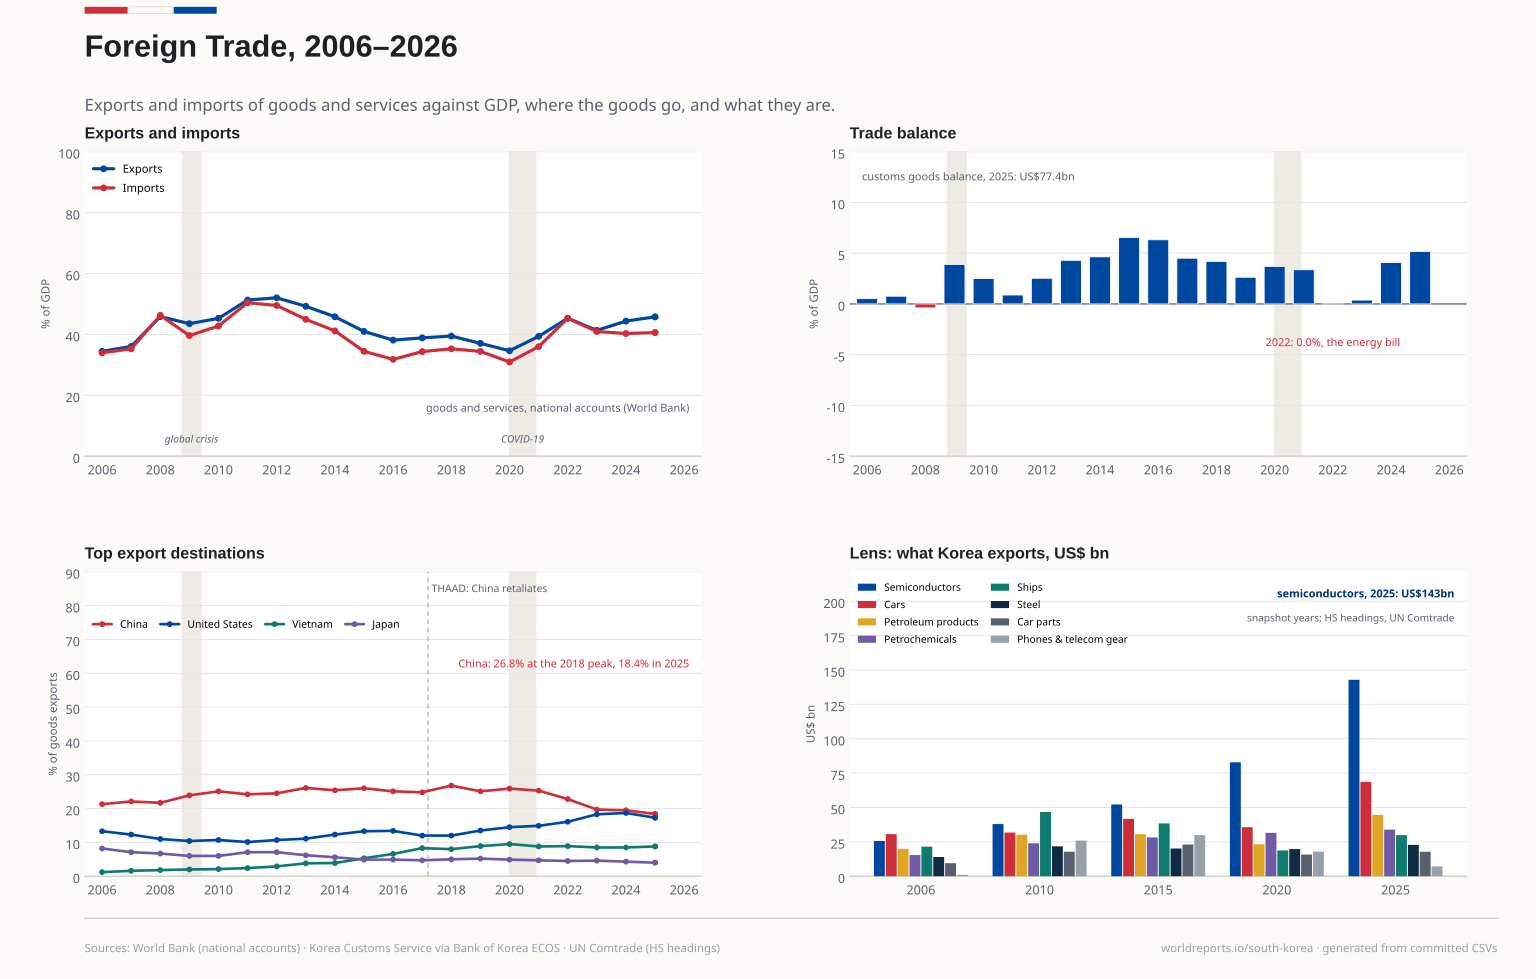
trade/destinations.csv | Exports by destination country | Korea Customs Service, via Bank of Korea ECOS | 2006-2025 | Official |
|---|
trade/exports_products.csv | Exports by product group, at five snapshot years | Korea, as reported to UN Comtrade | 2006-2025 | Official |
|---|
trade/trade.csv | Merchandise exports, imports and the trade balance | Korea Customs Service, via Bank of Korea ECOS | 2006-2026 | Official |
|---|
trade/trade_from_wb.csv | World Development Indicators (NE.EXP.GNFS.ZS, NE.IMP.GNFS.ZS) | World Bank | 2005-2025 | Other |
|---|
trade/trade_gdp.csv | Exports and imports of goods and services, % of GDP | World Bank (national accounts) | 2006-2025 | Other |
|---|
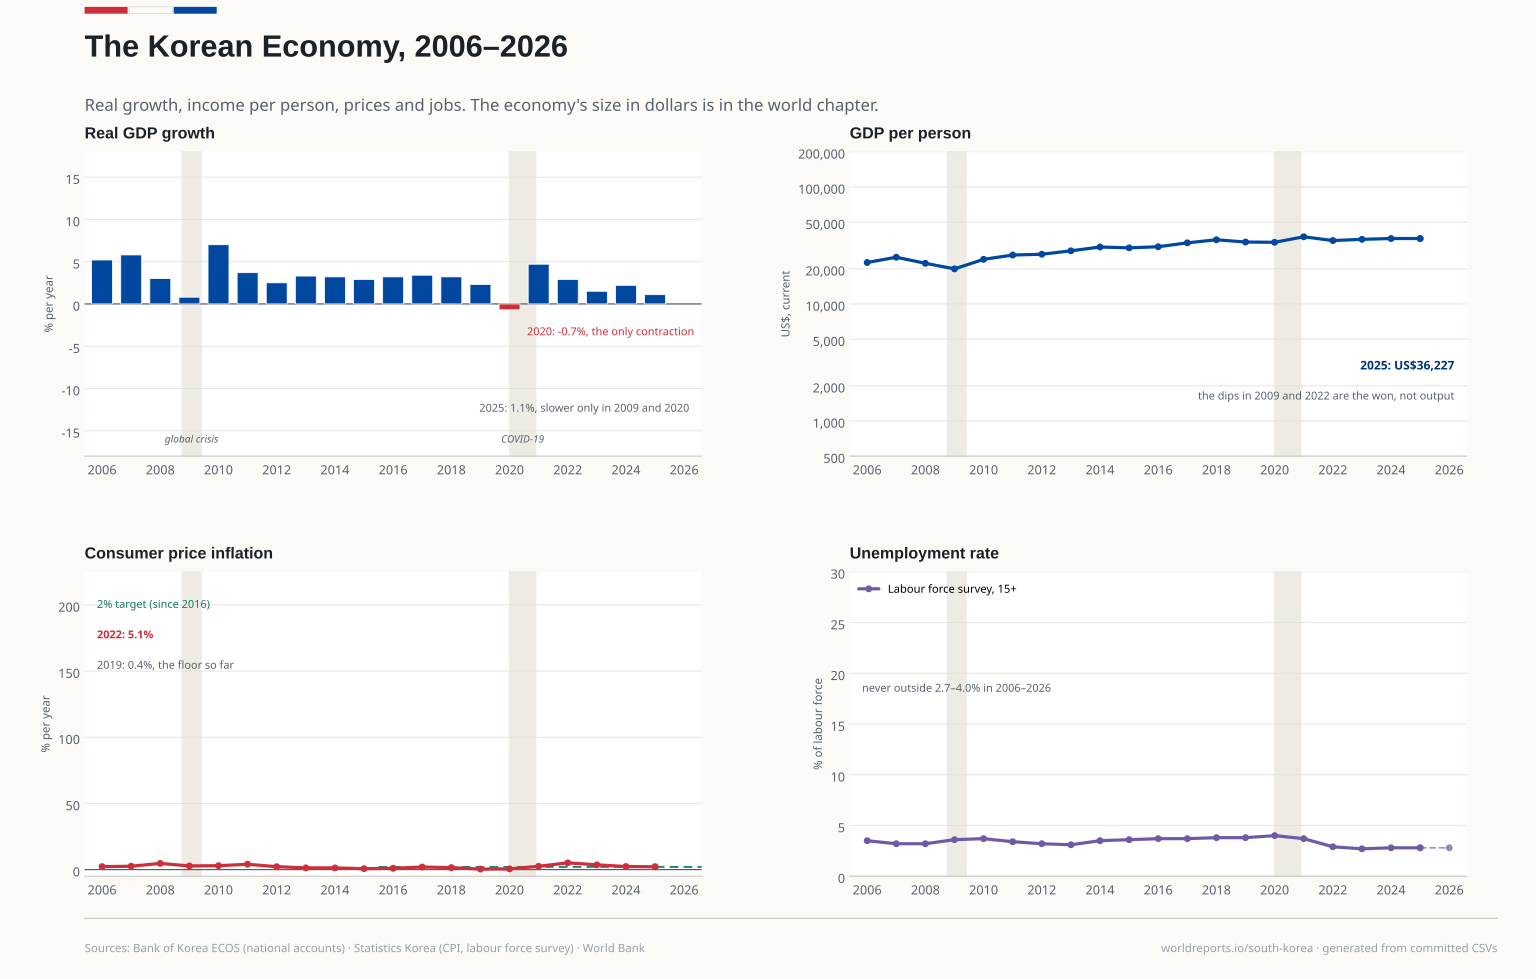 Plate 01